Internal Charging Indicators
Data Product of WP7

This page gathers the key Internal Charging Risk Indicators (ICRI) for the whole set of surveyed Reference Missions. For each Reference Mission and each six-hours time slot, the ICI is symbolised by simple tricolour indicators:
- Green disk means no internal charging risk is expected, according to the ECSS standards, i.e. strongest electric field in the device remains lower than 1 kV/mm;
- Orange disk indicates that, the strongest electric field in the device is between 1 and 10 kV/mm that can induce risk of internal breakdown for aged dielectrics;
- Red disk indicates that, the strongest electric field in the device is higher than 10 kV/mm that can induce risk of internal breakdown for pristine dielectrics.
The flags are triggered considering if at least ONE of the Charging Models find that the differential potential between two elements of the selected Modelled Platform is upper or lower the ECSS reference threshold voltages.
Download: Internal Charging Indicators data (JSON)
Caution, Limits and Discussion of Results
The charging risk analysis is relative to the Modelled Platforms and Reference Missions. These values should be considered as basic indicator and important shifts might be observed with other platforms and locations in space, especially considering that threshold in charge can be observed depending on the local plasma conditions and the material properties (e.g. effect of the secondary emissions).
Please consider these indications with care. They should be carefully evaluated with you own embedded measurements (if any) to interpret the actually charging risk for your own mission.
NB: The present service is still currently under validation and results cannot be guaranteed. Please take care as well that the presented risk evaluation is relative to the Modelled Platform and Reference Mission. Actual charging risk depends on the platform design, the selected/sensitive technologies and the mission profile. The actual charging risk may differ for your own mission/modelled system. Please also remind that the risk indicators should be considered as a primary indicator of the charging events occurrence and not an accurate level of charge.
Time-dependent Internal Charging computation
Internal charging dynamic is governed by charge motion in dielectrics. The typical time constant of this phenomenon is mainly governed by the electrical conductivity of the targeted material and can be between a few hours to several hundred days. Generally, this time constant is long regarding the sharp and rapid variations of the high energy electrons flux spectrum generated by the environment.
Consequently, internal charging analysis are based on time dependant models solving differential equation governing the electrical charge motion. The calculation of the primary charge and dose depositions, used as input of these models depend on the environmental flux spectrum provided by the electron radiation belt forecast and as well on the shielding induced by matter already crossed by incident electrons. The way to calculate these source terms depends on the internal charging model:
- In the 1D model ICOne, the depsition profiles are directly calculated for each environment from 1D semi-empirical equations included in the software;
- In the 3D model SPIS-IC, the deposition maps are calculated as a combination of externally pre-computed maps, obtained from a Geant4 Monte-Carlo analysis with the SpaceSuite MoOra application, itself based on the ESA/GRAS kernel.
The final resulting electric field in the targeted dielectric, i.e. called «sensitive volume», resulting the final migration of charges, according to the local conductivity, is done using the SPIS-IC software.
To correctly evalute the internal charging state in a sensible element at the beginning of the forecast, the simulation has to take into account the historical evolution of the charge induced by the relativistic electron flux variation on a period longer than the typical time constant of the sensible element.
Reference Missions
The Modelled Platform is run considering a set of Reference Missions (i.e. orbits). These orbits have been selected to constitute references points for charging analysis, corresponding to existing missions, with embedded plasma instruments for instance, and/or localisations of interests.
Please consider this carefully for the interpretation of provided forecast with respect to your own mission. Please see the Caution, Limits and Discussion of Results page for further details.
Currently available Reference Missions are:
- GOES 16
- 41866U 16071A 22076.38002431 -.00000251 00000+0 00000+0 0 9995
- 41866 0.0811 288.6024 0000976 94.3574 213.5475 1.00272205 19546
- GOES 18
- 51850U 22021A 23136.98729892 .00000094 00000+0 00000+0 0 9996
- 51850 0.0185 77.7180 0000275 270.5113 104.6214 1.00270247 4508
- ARASE (ERG)
- 41896U 16080A 23136.22668449 .00000719 00000+0 18252-2 0 9995
- 41896 31.5230 94.5070 6994071 82.0303 345.7147 2.54746198 59350
- GIOVE-A
- 28922U 05051A 23136.66449137 -.00000104 00000+0 00000+0 0 9993
- 28922 58.6864 23.3192 0024087 130.5519 87.1837 1.69329618107611
CAUTION: The TLE (Two Line Element) of each mission can be expected to be changed, to take into account of the deviation from the theorical satellite trajectory.
To improve both high time resolution (i.e. update rate) as well accuracy of results and, by cross-comparison, the general confidence in the final charging risk prediction, the Charging Risk Forecast Service combine different charging models.
- ICOne
The 1D internal charging model ICOne is based on a semi-analytical model of charge and dose deposition, weakly coupled with a 1D conduction model. - SPIS-IC
SPIS-IC requires the prior computation of the source terms of space charge and dose rates resulting from the transport of primary electrons through the spacecraft structure. This is done beforehand using a 3D direct Monte-Carlo approach, thanks to the GRAS/Geant4 software. To reduce the huge CPU cost of such simulations, the time-dependent deposition maps for each environment are obtained by convolution of pre-computed reference ones. These reference maps are computed with the help of MoORa, a complete modelling environment for GRAS/Geant4.
To draw the actual charging risk factor, it is recommended to carefully consider both results and cross-validate them.
Modelled Platform Review
The charging risk is computed considering simplified relevant equivalent systems, with simplified geometries and/or reduced material choices. These simplified platforms generally do not directly correspond to your own system but to configurations where the charging processes can be clearly identified and should be considered as a reference charging markers.
For this reason, the charging risk evaluation should be considered with care, as indicator of occurrences of charging events only, and correspondences to your own platform should be interpreted and calibrated, eventually according to your embedded measurements, if any.
Please note that available Reference Platforms depend as well on the used Charging Models and their underlying limitations and approximations.
IC1 to IC7 (Dielectric Samples)
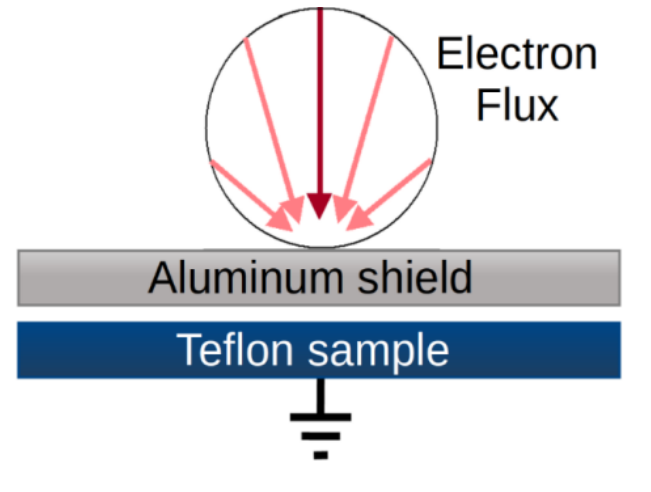
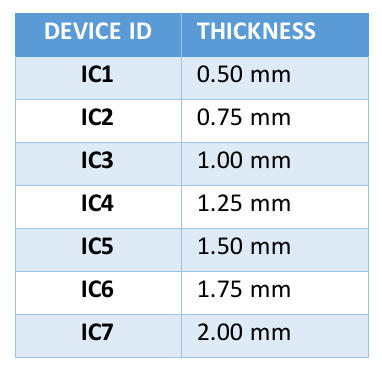
The first devices are simple 1 mm thick Teflon samples protected from the relativistic electron flux by an Aluminium shield. The various devices represent various thickness of the shielding varying from 0.5 mm to 2 mm. The table below summarises the thickness of the shielding for each device.


The irradiated face of the sample is floating, while the other face is connected to the ground. The sample charging is simulated with both: ICOne model the sample as a 1D element whereas SPIS-IC models it as a 2cm per 2cm square surface. The bulk conductivity of 1016 S/m and the 2.1 relative permittivity held for the Teflon induce a 2 days duration for electric field decay. which implies that the risk of internal charging at a given moment is mainly influenced by the evolution of the environment of the two previous days
The resulting electric field is extracted from the simulation and compared to the risk thresholds.
IC10 (Coaxial cable) [3D / SPIS-IC only]
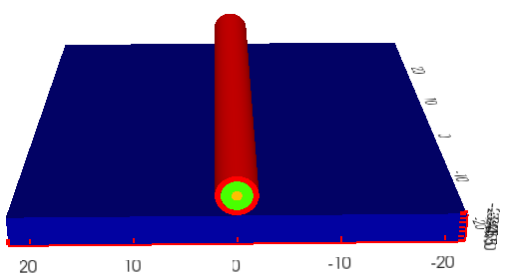
The coaxial cable device is a superposition of three cylindrical layers with a 20 mm length:
- a 0.6 mm thick external layer of Aluminium;
- a 1 mm thick insulation layer made of Teflon;
- a 1.1 mm thick Copper core.
The coaxial cable is situated on an Aluminium layer representing a spacecraft surface.

In order to represent an infinite cable, the dose rate and charge deposition in the insulator has been computed with GRAS/MoORa on a 5 mm section in the centre of the GDML geometry. The charge motion on this section is calculated with SPIS-IC assuming both conductive components of the cable are grounded.
The resulting electric field is extracted from the Copper core element and compared to the risk thresholds.
Please see Caution, Limits and Discussion of Results for further details.

